Energy Map
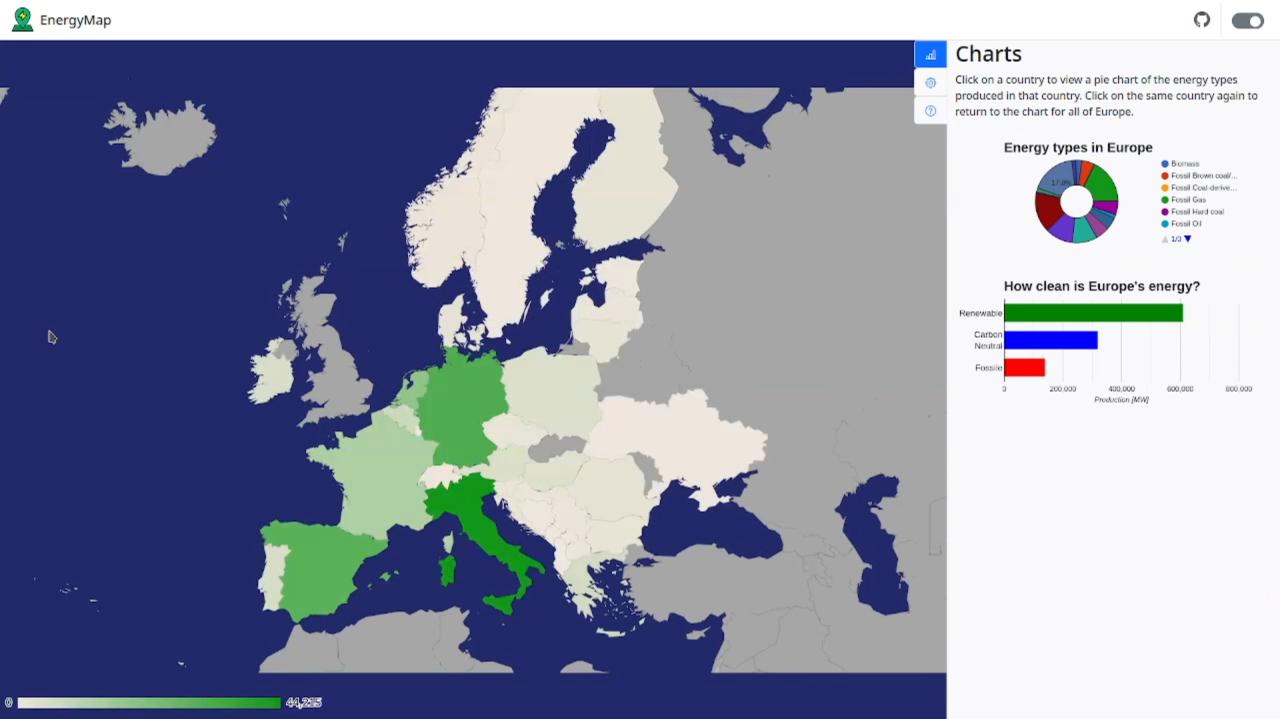
This project centers around the creation of an interactive map designed to showcase energy production across Europe. This map isn't just a static image; it's a dynamic tool that empowers users to explore, discover, and understand the energy landscape of this diverse continent.
The project was developed in an agile enviroment, using Java and Node.js for the backend and Bootstrap for the frontend. The map itself is built using google charts.
Fork or star on Github